09 Nov GUARD: Successful development of user interface for identifying and reacting to cybersecurity threats
The development of the GUARD user interface involved the development of three main components. Namely, service topology, security pipelines and a reaction and mitigation component. The result is a user interface that allows the user to easily identify the various services in the GUARD system, manage and deploy security agents in the GUARD environments supported by the security pipelines and react and mitigate the threats that are identified by the agents and presented to the user in a visual and tabular format.
The GUARD user interface has the objective to connect the different components and services of the GUARD infrastructure with the end user. These services are responsible for the monitoring and tracking of cybersecurity threats that might appear in the environment the GUARD software is deployed on. To allow user-friendly managing and monitoring of the services and threats, the user interface consists of three main components:
- The service topology is responsible for showing the connection and relation between the different services within the GUARD environment.
- The security pipeline component helps the user to set up and manage various agents (thread identification systems) in different instances.
- The react and mitigation component consists of visualisations and an alert system that is responsible for notifying the user of any threats.
Moreover, while using the dashboard, the user benefits from general features such as a secure authentication system with roles and permissions functionalities and user related features.
Service Topology
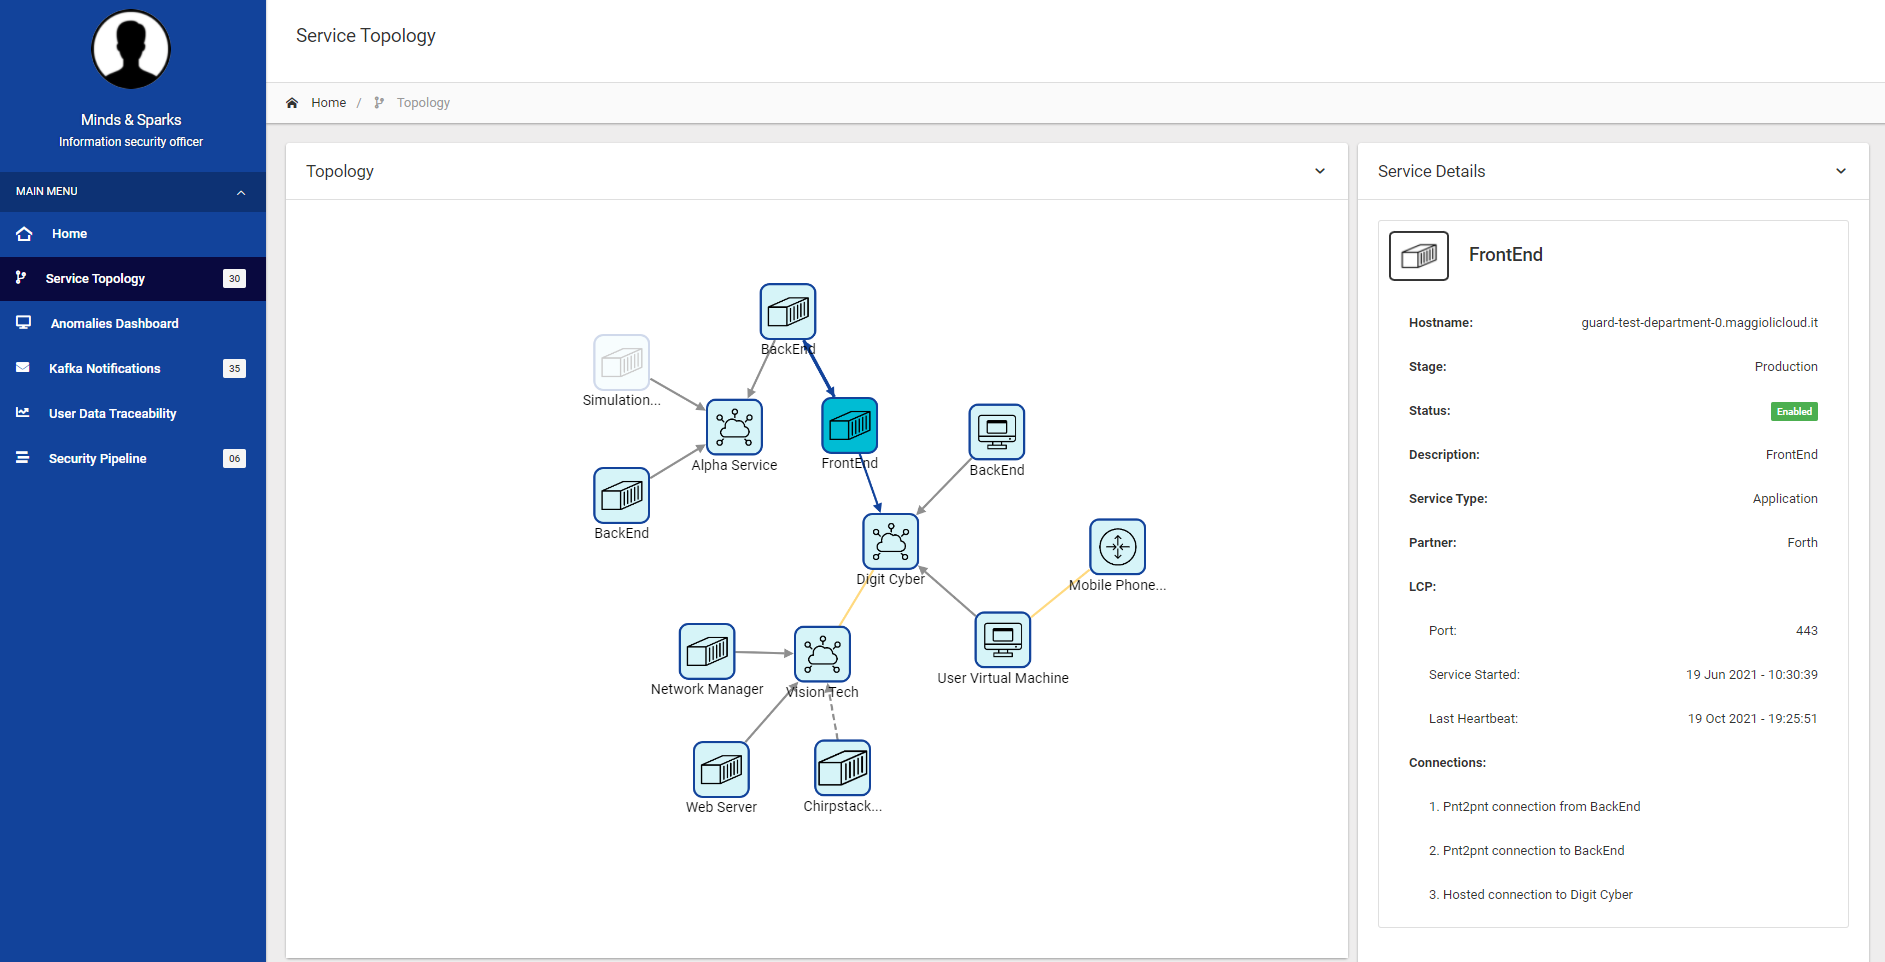
As mentioned above, the service topology visualisation feature provides the user with an overall topology of services in the GUARD framework in an interactive network visualisation. As presented in the figure below, the service topology simplifies the complex relations between the different services and environments in the GUARD system. Also, once a service is selected, it provides detailed information about each service. This detailed information can be found on the right side of the network graph visualisation (see figure below).
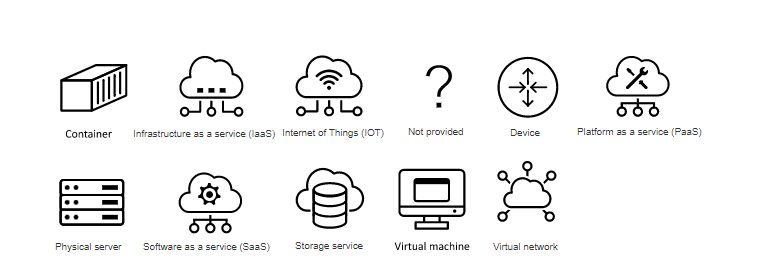
Project specific topology icons were researched, analysed and established. These icons are meant to support the user to quickly understand the different services and their respective service type, e.g. software as a service (SaaS, Virtual Machine). The defined icons can be seen in the figure below.
Security Pipelines
Security pipelines centrally manage one or more agent instances and allow the user to deploy different security agents in the various environments available inside the GUARD system. These agents actively monitor the environment and create notifications if a threat is identified.
The security pipeline component offers the following features:
- Create pipeline
- Edit pipeline
- Delete pipeline
- Start pipeline
- Stop pipeline
- Restart pipeline
- Reload pipeline configuration
Reaction and mitigation
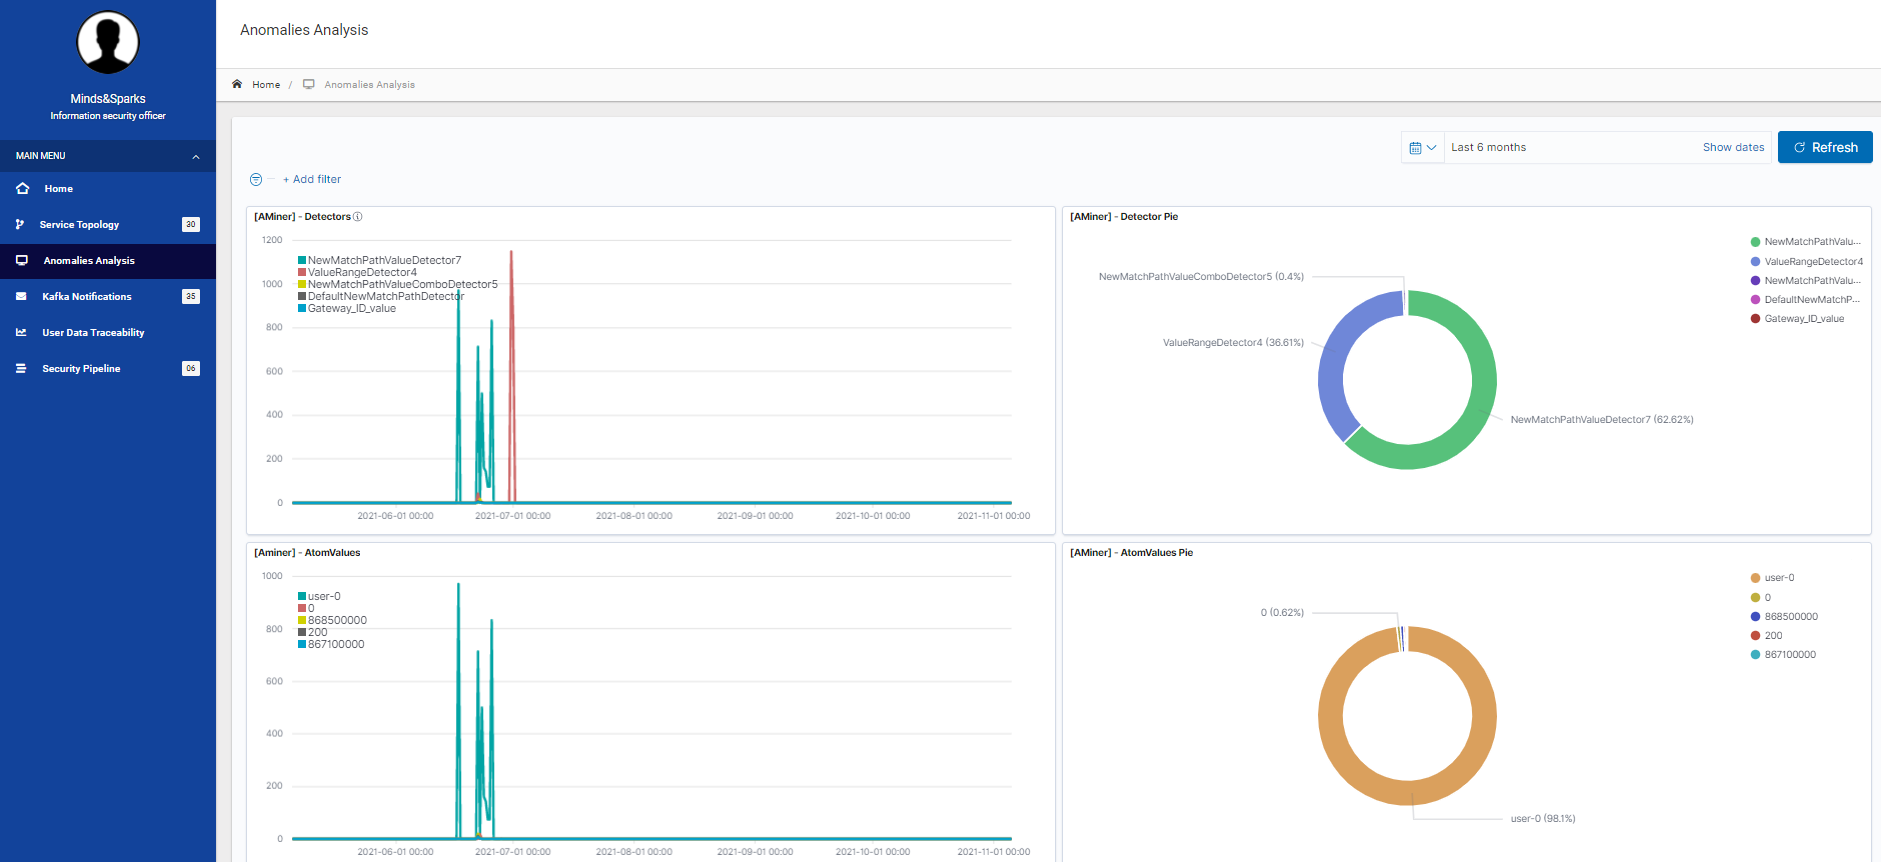
Once security pipelines are created and started, the deployed agents send messages to the reaction and mitigation component which uses a threat notification page and an anomalies analysis page to notify and alert the user of the identified threats.
The threat notification lists the threats in a table including threat information such as agent source, severity, description, data and date/time. The anomalies analysis visualises the past anomalies detected and categorises them into groups in order for the user to see the results at one glance. An example can be found in the figure below.